Our Tools
An overview of all tools currently produced and supported by the Anderson Lab
Over the last few years the lab has slowly but surely began to develop a series of different computational, data analysis and image analysis tools. This is largely driven by our own needs, but in the spirit of collaboration, sharing and open science we are now making these tools available to everyone. Below is a brief description of each tool with a link to a where the tool can be downloaded and any associated publication. If you use these tools in your own research or improve them, please let us know and acknowledge our original source.VALIS: Virtual Alignment of pathoLogy Image Series
VALIS, which stands for Virtual Alignment of pathoLogy Image Series is a fully automated whole slide image (WSI) registration pipeline. VALIS is flexible, being able to align both immunohistochemistry (IHC) and immunofluorescence (IF) images, whole slide images (WSIs) or regions of interest (ROIs), H&E images or collections of different markers, serial slices and/or cyclically stained images. VALIS can register any number of images, find rigid and/or non-rigid transformations, and apply them to a slides saved using a wide variety of formats (via Bio-Formats and OpenSlide). The registered slides can be saved in the ome.tiff format for downstream analysis, or merged to create highly multiplexed images. The transformations found by VALIS can also be used to warp point data, such as cell positions, facilitating spatial analyses using existing datasets. As VALIS is fully automated, there is no need to define a reference image, nor provide H&E images, making it easy to accurately register large collections of WSI. VALIS is written Python, and readily available on IMO GitHub pages at: MathOnco/VALIS and PyPi, with full documentation found on ReadTheDocs. VALIS therefore provides a free, opensource, flexible, scalable, and easy to use pipeline for rigid and non-rigid registration of WSI, facilitating spatial analyses of prospective and existing datasets, breathing new life into the countless collections of brightfield and immunofluorescence images. Further details on how to implement and use VALIS are available in our 2023 Nature Communications paper, Doi: 10.1038/s41467-023-40218-9.
GATTACA: Base pair resolution mutation tracking for agent-based models
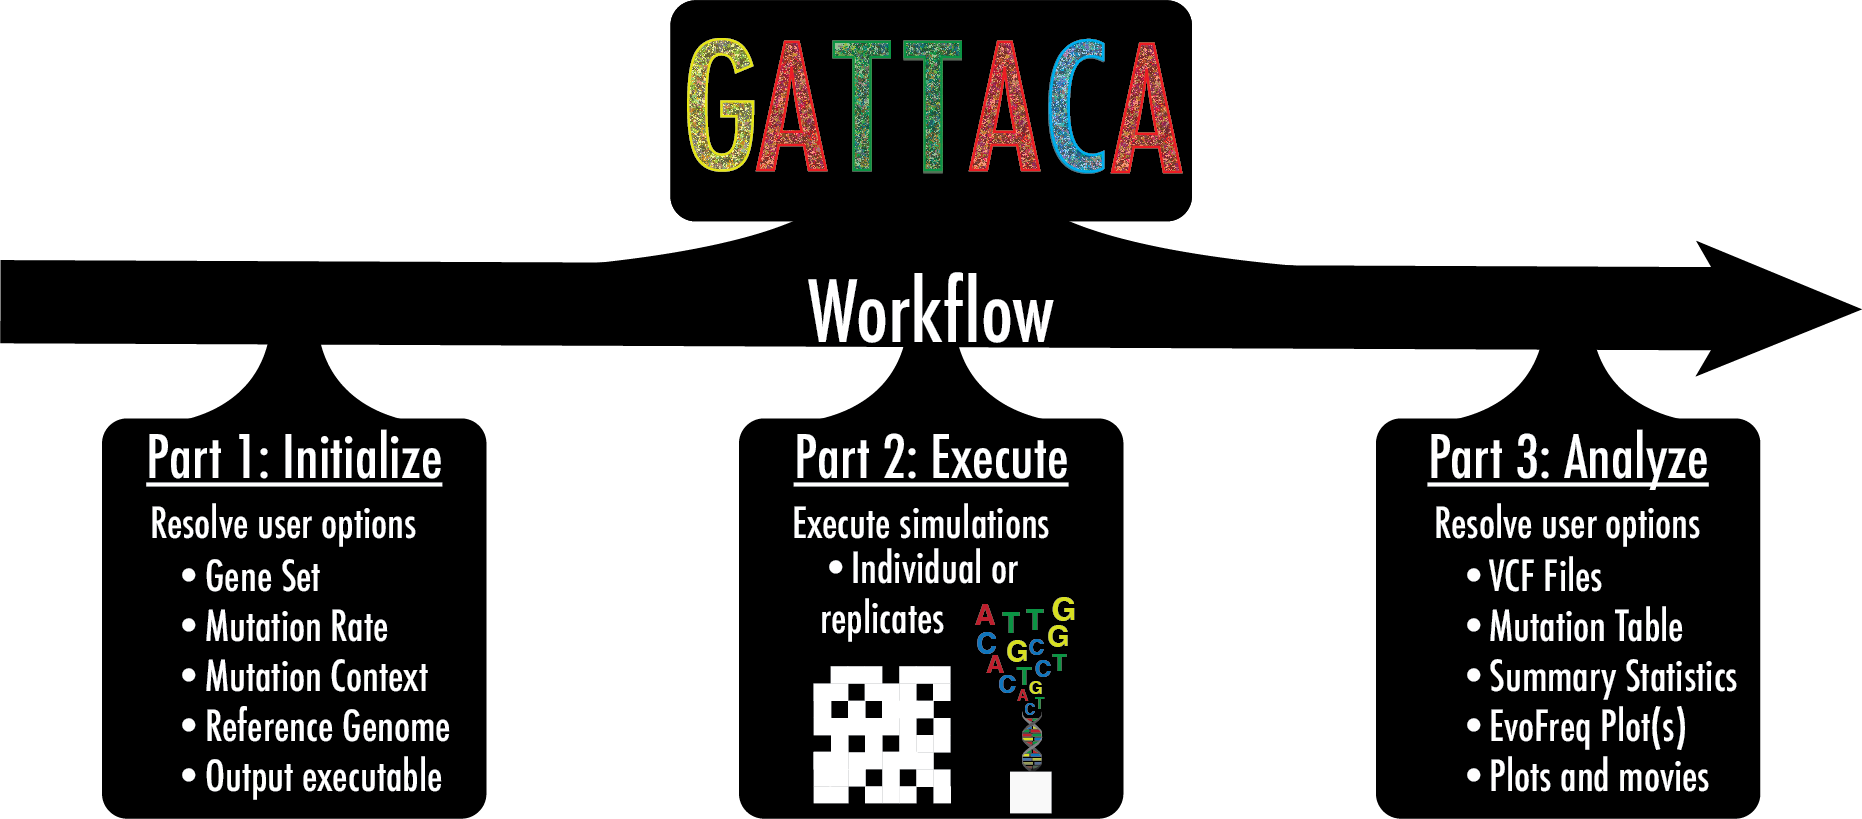
Gattaca is the first tool that provides a means of inducing and tracking base pair resolution SNVs within an agent-based modeling framework with temporal, spatial, and genomic positional information. The primary goal of Gattaca is to provide users with a means to perform null simulations that are capable of explicitly modeling neutral somatic mutation within spatial contexts; however, beyond this, users can adapt this methodology for non-neutral dynamics through thoughtful introduction of functional heterogeneity. This crucially provides an ability to accurately capture mutation data on a level comparable to sequencing experiments from the clinic or research settings. Through the incorporation of human reference genomes, mutational context, sequence coverage/error information Gattaca can realistically provide comparable sequence data for in-silico comparative evolution studies with human somatic evolution studies. This user-friendly method, incorporated into each in-silico cell, allows us to fully capture somatic mutation spectra and evolution. Gattaca can be downloaded from the IMO GitHub pages at: MathOnco/Gattaca. Our paper highlighting 2 different use cases was published in Molecular Biology and Evolution (Schenck et al, 2022).
Mistic: an open-source multiplexed image t-SNE viewer
Mistic is a software package written in Python and uses the visualization library Bokeh. Mistic can be used to simultaneously view multiple multiplexed 2D images using pre-defined coordinates (e.g. t-SNE or UMAP), randomly generated coordinates, or as vertical grids to provide an overall visual preview of the entire multiplexed image dataset. This grouped view of all the images further aids an exploratory understanding of the specific expression pattern of a given biomarker or collection of biomarkers across all images, helps to identify images expressing a particular phenotype or to select images for subsequent downstream analysis. Mistic also allows metadata of the multiplexed images to be displayed. Currently there is no freely available tool to generate such image t-SNEs. Mistic is open-source and can be downloaded directly from the IMO GitHub pages at: MathOnco/Mistic. Our paper with further details on how to use Mistic was recently published in Patterns (Prabhakaran et al, 2022).
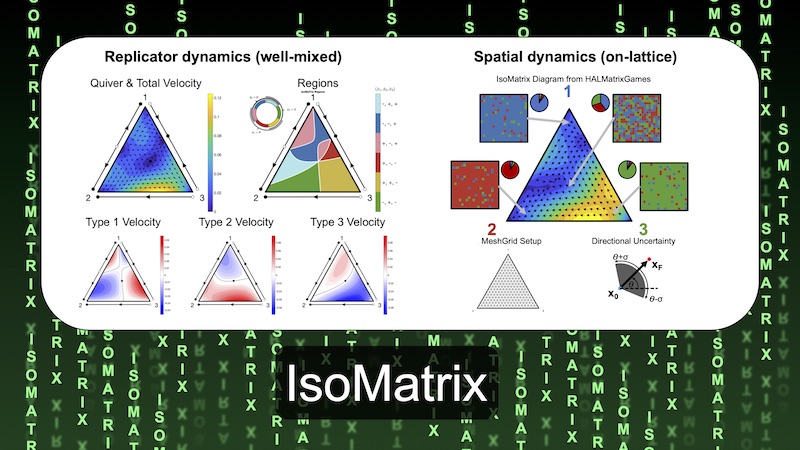
IsoMatrix - Isoclines of Matrix Games
IsoMaTrix is software package designed to aid in the construction, analysis, and visualization of three-strategy matrix games. Evolutionary game theory, a common modeling framework in math oncology, describes frequency-dependent selection for fixed, heritable strategies in a population of competing individuals using a payoff matrix. The name of the IsoMaTrix package is inspired by its computation of the isoclines (lines of zero growth) of matrix games, but the package also contains functions which visualize the replicator equation's 1) fixed points, 2) phase flow, 3) velocities, 4) trajectories, 5) regions of positive/negative strategy fitness 6) basins of attraction. IsoMaTrix contains a module extension for Hybrid Automata Library to perform simulation-based analysis and uncertainty quantification for stochastic effects in spatial matrix games.To download it directly from the IMO GitHub pages please head over to MathOnco/IsoMatrix. Our paper explaining how to use IsoMatrix in more detail was published in Bioninformatics (West et al, 2020).

HAL - Hybrid Automata Library
HAL is a Java library that facilitates the development and implementation of hybrid matheamtical models. Hybrid Modeling is the integration of Agent-Based modeling and Partial Differential Equation (PDE) modeling. It is commonly used in mathematical oncology to mechanistically model tumor-tissue interactions. Tissue/Tumor is represented using the agent-based modeling, where each agent acts as a single cell. Diffusibles that interact with the tissue are represented using the PDEs. HALs components can be broadly classified into: on and off-lattice agent containers, finite difference diffusion fields, a GUI building system, and additional tools and utilities for computation and data collection. These components have a standardized interface that expedites the construction of complex models. This library has been used in several PSOC modeling efforts and has facilitated designing and sharing models at Moffitt IMO. For more information on how to install and use HAL head over to our dedicated website halloworld.org. Or if you prefer to download it directly from the IMO GitHub pages please head over to MathOnco/HAL. Our paper that explains how to use HAL in more detail, along with a specific example, is available at Plos Computational Biology (Bravo et al, 2020).
EvoFreq - Visualization and Animation of Evolutionary Dynamics
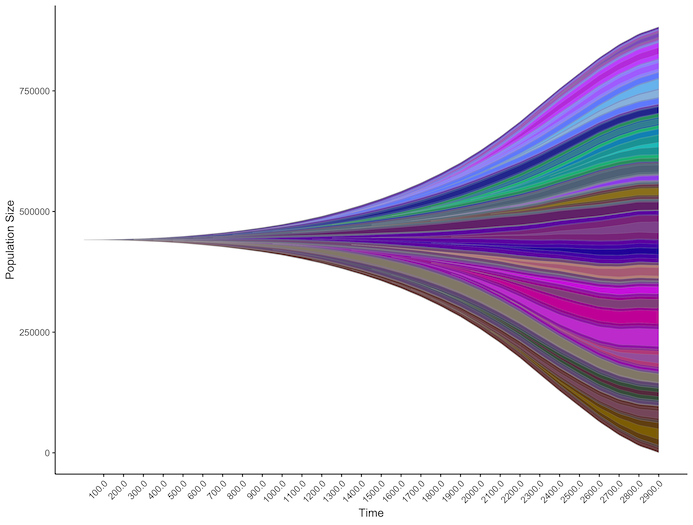 EvoFreq is a package for the R programming language that can be used to visualize evolutionary dynamics using simulated or experimental data. EvoFreq is designed to be easy to use, flexible, and create high quality plots and animations using the popular ggplot package. EvoFreq visualizes evolutionary dynamics using Muller plots and dendrograms. In Muller plots, each polygon represents the frequency of a mutation in the population, and nestedness shows phylogenetic relationships, while the dendrograms simply show the phylogenetic relationship between gentoypes. EvoFreq also provides tools to parse clonal architecture data from CALDER, PhyloWGS, and ClonEvol, making it easier view experimental data. Simulation results from HAL can be read directly by EvoFreq, again making it easy to view simulated data. While some of these features are specific to data/simulations from cancer research, EvoFreq can be used with a wide variety of datasets, and should be of use to the wider field of biology. To download it directly from the IMO GitHub pages please head over to MathOnco/EvoFreq. A paper that explains how to use EvoFreq in application to both real and simulated was recently published in BMC Bioinformatics (Gatenbee et al, 2019). You may have noted that the HAL simulation above and the EvoFreq plot are directly related? In fact, HAL can output clonal dynamics that can easily be visualised with EvoFreq, take a look at this great blog post by Jeff West explaining exactly how this works and how easy it is to implement.
NeoPredPipe - Neoantigen Prediction Pipeline
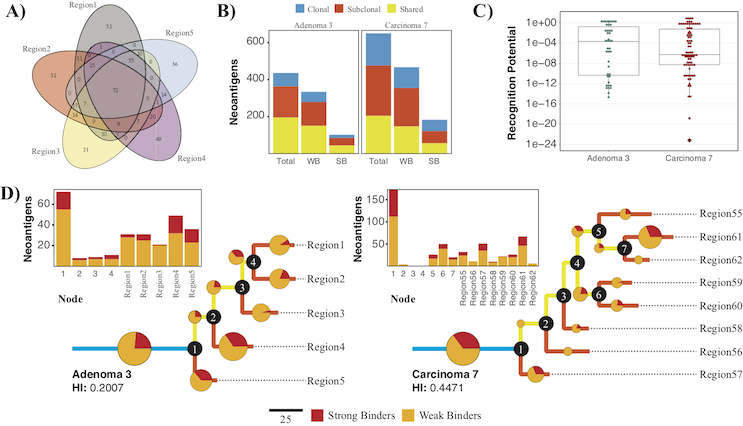 This pipeline was developed as a contiguous means of predicting putative neoantigens and their corresponding recognition potentials for both single and multi-region tumor samples. NeoPredPipe is able to quickly provide summary information for researchers, and clinicians alike, on neoantigen burdens while providing high-level insights into tumor heterogeneity given somatic mutation calls and, optionally, patient HLA haplotypes. Given an example dataset we show how NeoPredPipe is able to rapidly provide insights into neoantigen heterogeneity, burden, and immune stimulation potential. Through the integration of widely adopted tools for neoantigen discovery NeoPredPipe offers a contiguous means of processing single and multi-region sequence data. NeoPredPipe is user-friendly and adaptable for high-throughput performance. NeoPredPipe is freely available from the IMO GitHub pages MathOnco/NeoPredPipe. This pipeline was developed in collaboration with Trevor Grahams lab and was published in BMC Bioninformatics (Schenck et al, 2019).